Continuous Random Variables
The Problem
Suppose \(P(X = x) = \epsilon > 0\) for every \(x\) in \((0,1)\).
How many real numbers lie between 0 and 1?
So \(P(X = x) = 0\)
Let \(X\) be uniform on \([0, 10]\).
This does not mean 3 cannot happen. It is in the support. For continuous variables, probability zero is not impossibility.
But it does mean the PMF is not helpful here! We need a different function.
Income
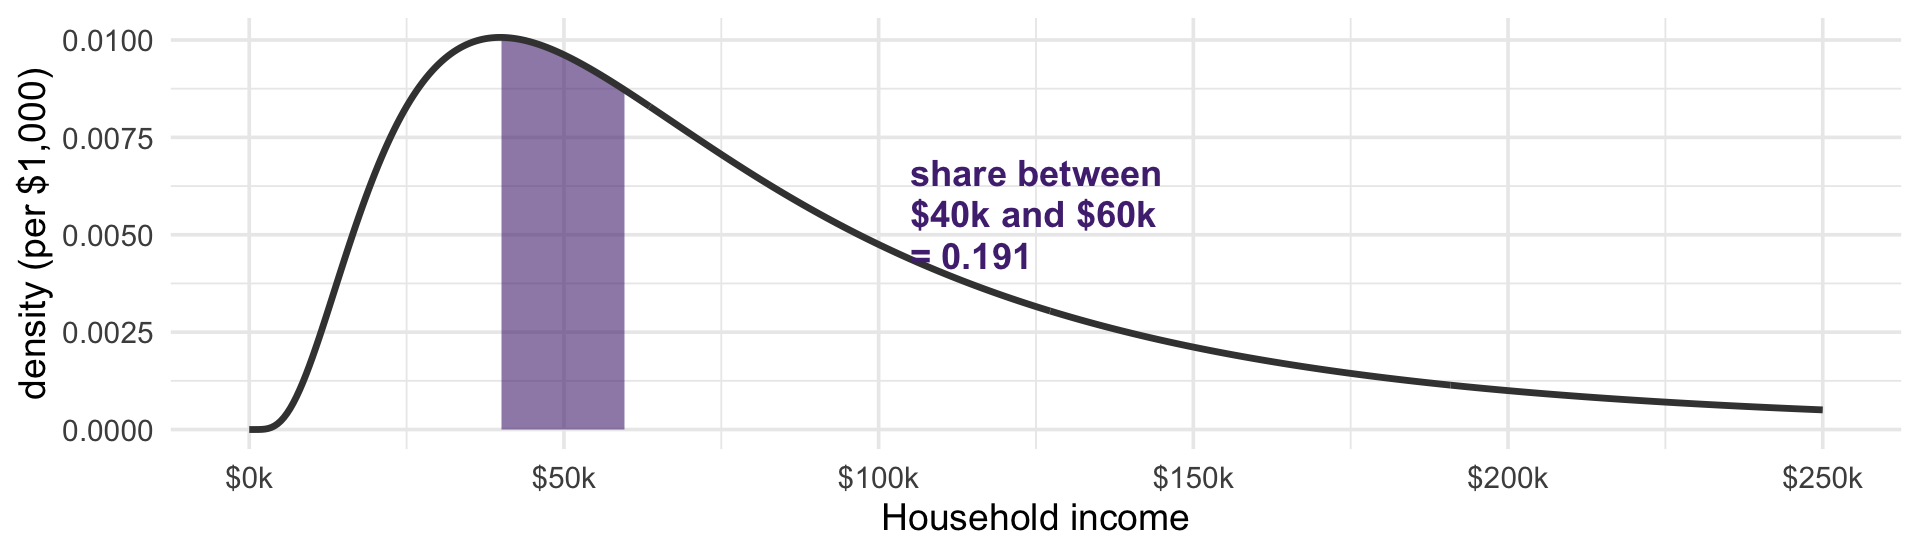
Let \(X\) be the income of a randomly chosen household. \(P(X = \$52{,}353.07)\), to the penny, is zero.
![]()
The questions we ask are about bands: what share of households sit between $40,000 and $60,000? That is the shaded area, about 19%.
The CDF Still Works
\[F_X(x) = P(X \leq x)\]
\(P(X \leq 3)\) is perfectly sensible even when \(P(X = 3) = 0\)
\(X\) is continuous if its CDF is a continuous function
Intervals are easy: \(P(a < X \leq b) = F_X(b) - F_X(a)\)
The Probability Density Function
The PDF is the function \(f_X\) with
\[F_X(x) = \int_{-\infty}^{x} f_X(t)\,dt\]
By the fundamental theorem, the PDF is the derivative of the CDF, and probabilities are areas under it:
\[P(a < X < b) = \int_a^b f_X(x)\,dx\]
The CDF accumulates; the PDF is its rate of accumulation.
The CDF Is a Percentile Function
![]()
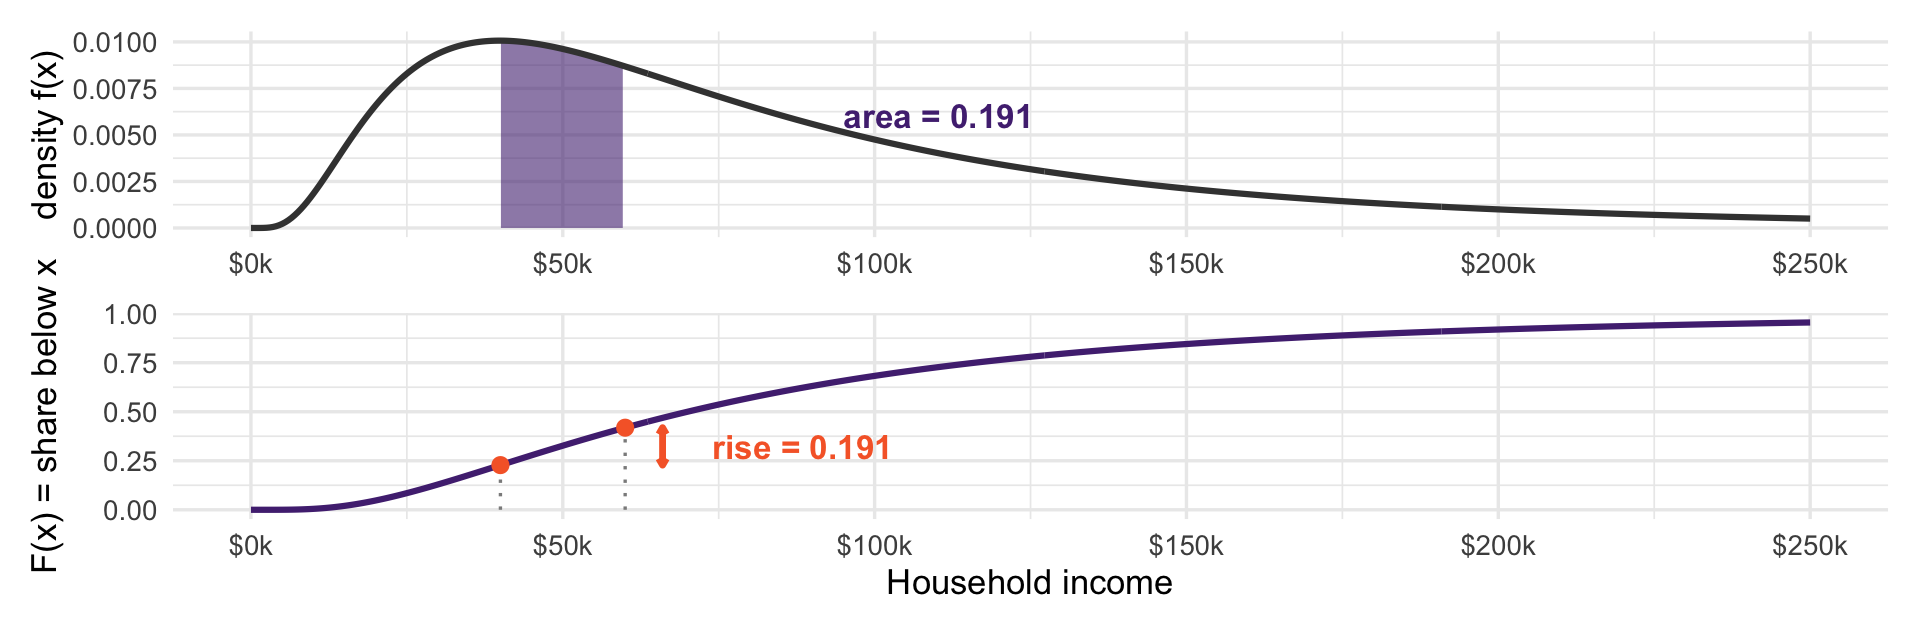
You already use this function: \(F(x)\) is the percentile. “The 80th percentile is $131,593” says \(F(131{,}593) = 0.8\), and the median is where \(F\) crosses 0.5.
An interval probability is the rise in the CDF, which is the same number as the area above it.
The density is the slope of the percentile curve: steep where households pile up, nearly flat out in the tail
Density Is Not Probability
\(f_X(x)\) is not \(P(X = x)\): we saw that is zero
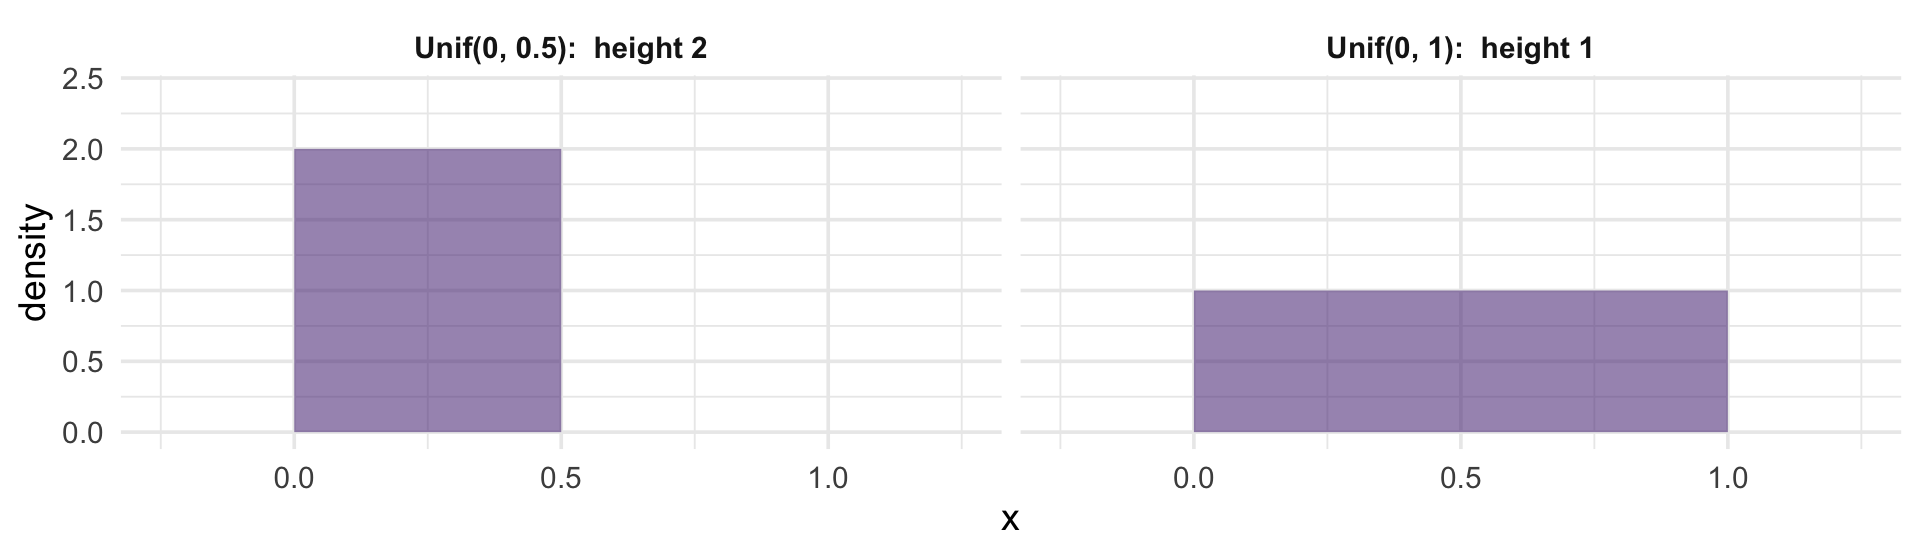
A density can exceed 1. Uniform on \([0, 0.5]\) has density 2 everywhere on its support. Why?
Density is probability per unit of \(x\)
Think of population density: people per square mile is not a number of people. To get people, you multiply by area. To get probability, you integrate.
Area Is Probability
![]()
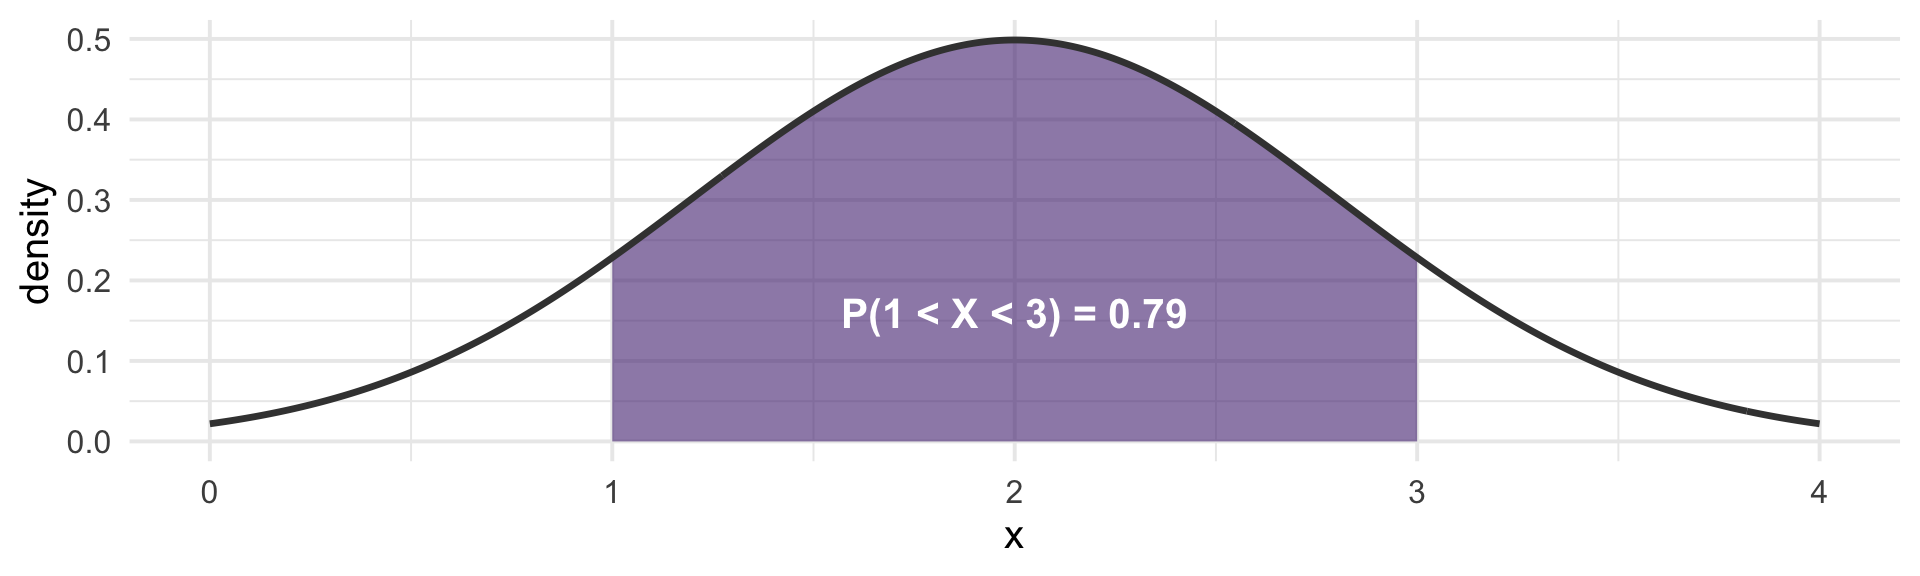
The height at any single point is not a probability.
However, the shaded area is a probability.
Properties of a PDF
Compare a PMF: non-negative, sums to one. The same rules, with \(\int\) for \(\sum\).
Note: \(P(a < X < b) = P(a \leq X \leq b)\). Why?
Expectation as a Balance Point
Discrete: \(\;E[X] = \sum_x x\, p_X(x)\)
Continuous: \(\;E[X] = \displaystyle\int_{-\infty}^{\infty} x\, f_X(x)\,dx\)
Both are “each value, weighted by how likely it is”
Physically: cut the density out of cardboard and \(E[X]\) is where it balances on a knife edge
Which is why a long right tail drags the mean: there is weight far out there
Where Does It Balance?
![]()
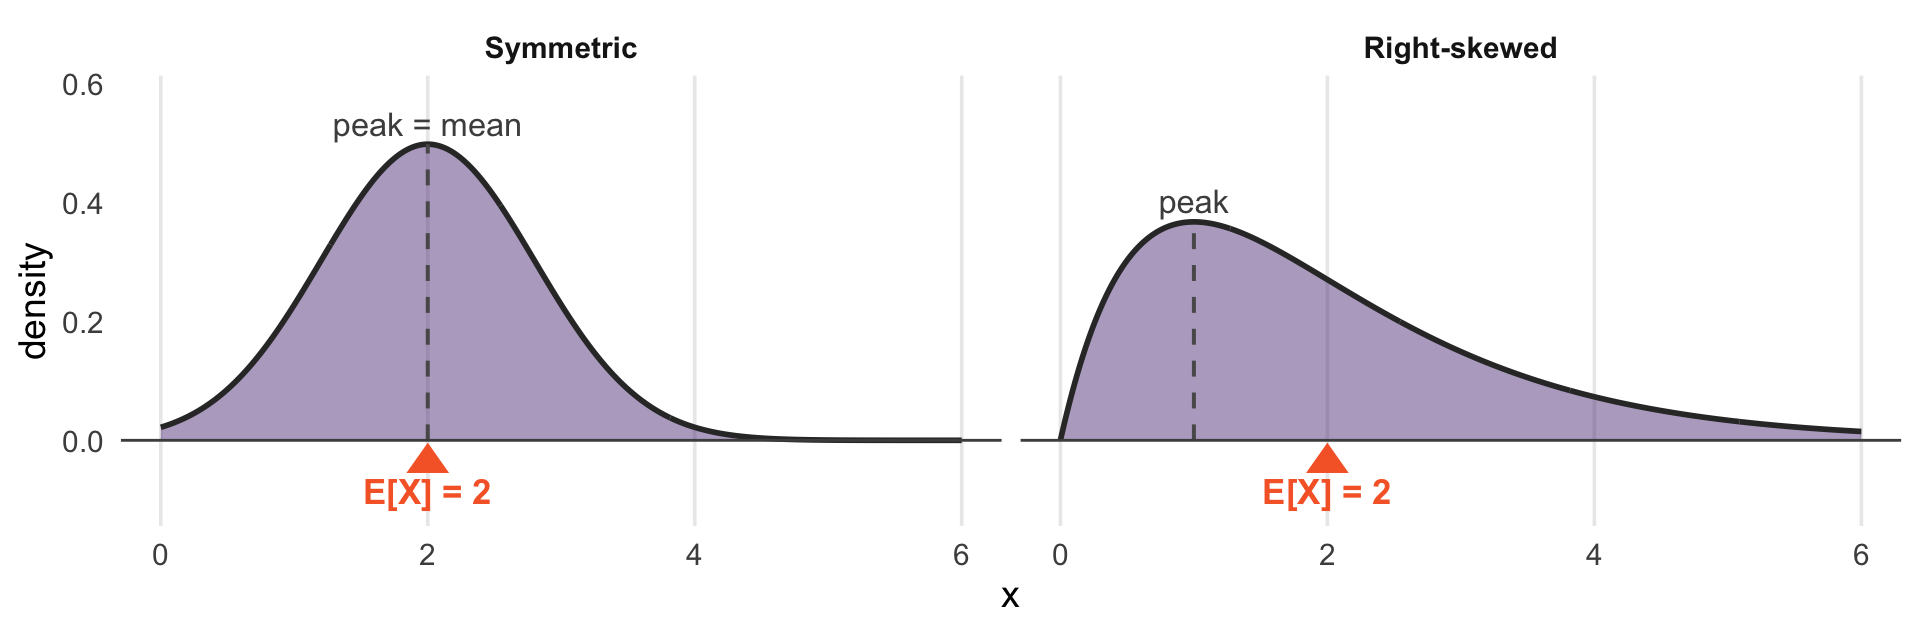
Both of these balance at 2. The symmetric one balances under its peak. The skewed one does not.
The Mean Is Not the Typical Case
On the last slide, the most common value is 1, but the distribution balances at 2
The thin right tail sits far from the fulcrum, so it carries a lot of leverage
Half the probability lies below 1.68 — the median — yet the mean is 2
The mean answers the question “where does the weight balance,” not “what does a typical case look like.”
The Translation Table
| PMF \(p_X(x) = P(X = x)\) |
PDF \(f_X(x)\), with \(P(X = x) = 0\) |
| \(\sum_x\) |
\(\int dx\) |
| \(\sum_x p_X(x) = 1\) |
\(\int f_X(x)\,dx = 1\) |
| \(E[X] = \sum x\, p_X(x)\) |
\(E[X] = \int x f_X(x)\,dx\) |
| CDF is a step function |
CDF is continuous |
The concepts are the same, but the mechanics change